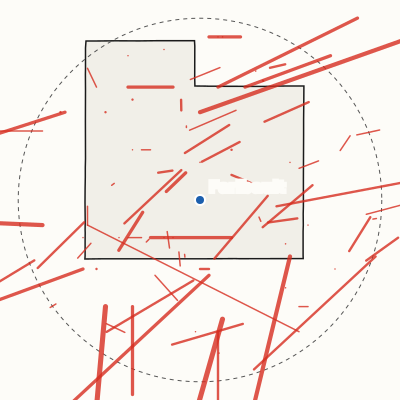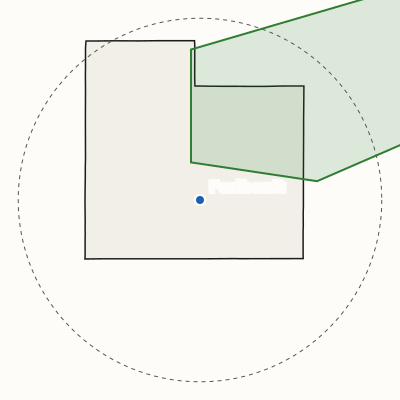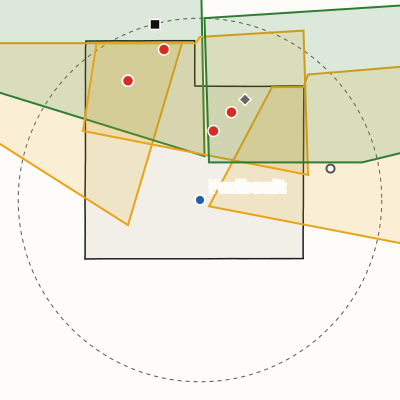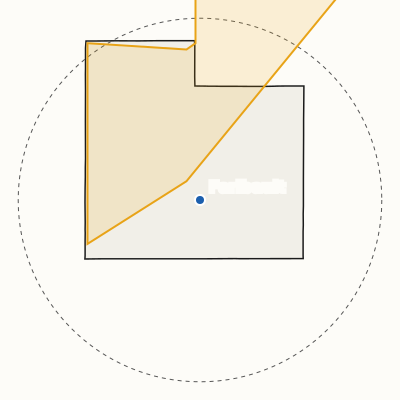
Dec. 19 to 20, 2012
3.5 inches of snow in Faribault
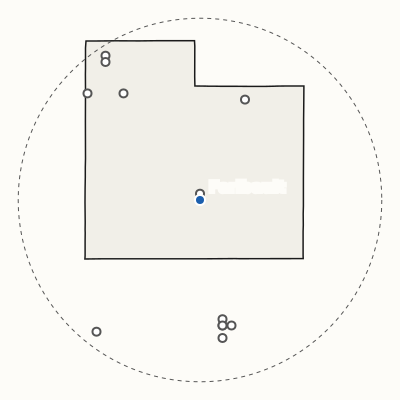
Largest snow within 20 miles: 5 in., 14 miles south of Faribault
- Dec. 19: Winter storm warning, 9 p.m. to 6 p.m. Dec. 20
Two storm days: Dec. 19 (winter storm warning), Dec. 20 (snow).
Storm log
Every National Weather Service warning for Rice County and every storm report within 20 miles of Faribault, day by day.
Warning: Issued when hazardous weather is happening, about to happen or very likely, and is a threat to life or property. National Weather Service glossary
Storm report: A local storm report: what a local National Weather Service office issues to share reports of severe or significant weather. National Weather Service glossary
The area this log covers
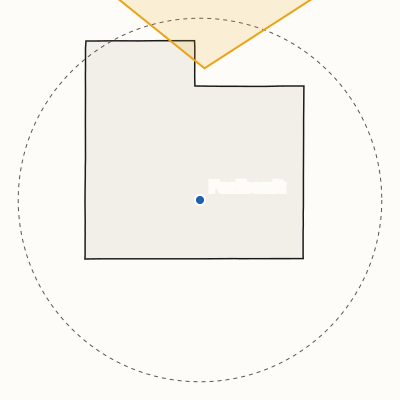
Every National Weather Service warning for Rice County (outlined) and every storm report inside the dashed circle, 20 miles around Faribault (the blue dot).
Current through Nov. 3
Follow new storm days in a feed reader: the storm-day feed (Atom), the 20 newest.
6 days with warnings only in 2012
Warnings only: days with a warning for Rice County and no storm reports.
Dec. 19 to 20, 2012
Largest snow within 20 miles: 5 in., 14 miles south of Faribault
Two storm days: Dec. 19 (winter storm warning), Dec. 20 (snow).
Wednesday, June 20, 2012
June 17 to 18, 2012
Two storm days: June 17 (flash flood warning), June 18 (hail).
Sunday, June 10, 2012
Saturday, May 19, 2012
Tuesday, Feb. 28, 2012
Average of 2007-2025; the band is the middle 8 in 10 of those years. Storm days: a warning for Rice County or a storm report within 20 miles.
| Year | J | F | M | A | M | J | J | A | S | O | N | D |
|---|---|---|---|---|---|---|---|---|---|---|---|---|
| 2026 | 0 | 0 | 0 | 2 | 0 | 1 | 1 | 0 | 1 | 1 | 0 | |
| 2025 | 0 | 0 | 1 | 2 | 2 | 3 | 3 | 4 | 1 | 0 | 0 | 0 |
| 2024 | 0 | 0 | 0 | 0 | 2 | 7 | 2 | 4 | 1 | 0 | 0 | 0 |
| 2023 | 0 | 0 | 0 | 0 | 0 | 1 | 4 | 3 | 0 | 1 | 0 | 0 |
| 2022 | 0 | 0 | 0 | 2 | 4 | 1 | 1 | 1 | 0 | 0 | 0 | 0 |
| 2021 | 0 | 0 | 1 | 1 | 3 | 2 | 0 | 3 | 1 | 0 | 0 | 1 |
| 2020 | 0 | 0 | 0 | 0 | 2 | 2 | 3 | 4 | 1 | 0 | 0 | 0 |
| 2019 | 0 | 0 | 0 | 3 | 0 | 1 | 6 | 3 | 2 | 1 | 0 | 0 |
| 2018 | 0 | 0 | 0 | 0 | 5 | 1 | 0 | 3 | 4 | 0 | 0 | 0 |
| 2017 | 0 | 0 | 1 | 0 | 3 | 4 | 3 | 2 | 1 | 0 | 0 | 0 |
| 2016 | 0 | 0 | 0 | 1 | 0 | 5 | 4 | 4 | 2 | 0 | 1 | 0 |
| 2015 | 0 | 0 | 0 | 0 | 2 | 2 | 3 | 0 | 1 | 0 | 0 | 0 |
| 2014 | 0 | 0 | 0 | 1 | 3 | 4 | 1 | 2 | 1 | 0 | 0 | 0 |
| 2013 | 0 | 0 | 0 | 0 | 1 | 5 | 2 | 0 | 0 | 0 | 0 | 0 |
| 2012 | 0 | 0 | 1 | 0 | 6 | 7 | 2 | 3 | 0 | 0 | 0 | 0 |
| 2011 | 0 | 0 | 0 | 1 | 5 | 1 | 5 | 3 | 0 | 0 | 0 | 0 |
| 2010 | 0 | 0 | 0 | 1 | 1 | 3 | 3 | 2 | 3 | 0 | 0 | 0 |
| 2009 | 0 | 0 | 0 | 0 | 0 | 1 | 1 | 1 | 0 | 0 | 0 | 0 |
| 2008 | 0 | 0 | 0 | 0 | 2 | 2 | 5 | 1 | 0 | 0 | 0 | 0 |
| 2007 | 0 | 0 | 2 | 1 | 1 | 3 | 2 | 5 | 1 | 1 | 0 | 0 |
Thunderstorm days in each month, 2007 through 2026 (this year so far): days with a tornado, severe thunderstorm or flash flood warning for Rice County, or a hail, tornado, funnel cloud, thunderstorm wind, flash flood or rain report within 20 miles (rain only from April through October). 1 or 2, 3 or more, one scale for both strips. The average is of 2007 to 2025.
| Year | J | F | M | A | M | J | J | A | S | O | N | D |
|---|---|---|---|---|---|---|---|---|---|---|---|---|
| 2026 | 1 | 3 | 3 | 1 | 0 | 0 | 0 | 0 | 0 | 0 | 0 | |
| 2025 | 0 | 1 | 3 | 0 | 0 | 0 | 0 | 0 | 0 | 0 | 4 | 4 |
| 2024 | 3 | 1 | 3 | 0 | 0 | 0 | 0 | 0 | 0 | 0 | 0 | 2 |
| 2023 | 5 | 4 | 4 | 2 | 0 | 0 | 0 | 0 | 0 | 0 | 0 | 0 |
| 2022 | 3 | 1 | 0 | 0 | 0 | 0 | 0 | 0 | 0 | 0 | 2 | 5 |
| 2021 | 4 | 1 | 2 | 0 | 0 | 0 | 0 | 0 | 0 | 0 | 0 | 4 |
| 2020 | 3 | 4 | 0 | 2 | 0 | 0 | 0 | 0 | 0 | 2 | 1 | 3 |
| 2019 | 3 | 10 | 3 | 4 | 0 | 0 | 0 | 0 | 0 | 0 | 3 | 0 |
| 2018 | 5 | 2 | 3 | 5 | 0 | 0 | 0 | 0 | 0 | 0 | 1 | 3 |
| 2017 | 3 | 2 | 2 | 0 | 0 | 0 | 0 | 0 | 0 | 0 | 0 | 2 |
| 2016 | 1 | 2 | 2 | 0 | 0 | 0 | 0 | 0 | 0 | 0 | 1 | 4 |
| 2015 | 1 | 1 | 3 | 0 | 0 | 0 | 0 | 0 | 0 | 0 | 1 | 4 |
| 2014 | 6 | 5 | 3 | 2 | 0 | 0 | 0 | 0 | 0 | 0 | 2 | 1 |
| 2013 | 2 | 3 | 7 | 6 | 3 | 0 | 0 | 0 | 0 | 0 | 1 | 1 |
| 2012 | 1 | 3 | 0 | 0 | 0 | 0 | 0 | 0 | 0 | 0 | 0 | 5 |
| 2011 | 1 | 2 | 2 | 0 | 0 | 0 | 0 | 0 | 0 | 0 | 0 | 3 |
| 2010 | 1 | 5 | 0 | 0 | 0 | 0 | 0 | 0 | 0 | 0 | 2 | 10 |
| 2009 | 4 | 3 | 2 | 1 | 0 | 0 | 0 | 0 | 0 | 1 | 0 | 9 |
| 2008 | 1 | 2 | 3 | 1 | 0 | 0 | 0 | 0 | 0 | 0 | 0 | 8 |
| 2007 | 3 | 6 | 3 | 0 | 0 | 0 | 0 | 0 | 0 | 0 | 0 | 1 |
Winter storm days in each month, 2007 through 2026 (this year so far): days with a winter storm, blizzard or heavy snow warning for Rice County, or a snow or ice report within 20 miles. A day can be in both strips. 1 or 2, 3 or more, one scale for both strips. The average is of 2007 to 2025.
37 storm days since 2007 are in neither strip, mostly flood warnings and non-thunderstorm wind. They count everywhere else on this page.
| Hour | Warnings |
|---|---|
| midnight | 18 |
| 1 a.m. | 8 |
| 2 a.m. | 11 |
| 3 a.m. | 12 |
| 4 a.m. | 6 |
| 5 a.m. | 4 |
| 6 a.m. | 8 |
| 7 a.m. | 3 |
| 8 a.m. | 10 |
| 9 a.m. | 10 |
| 10 a.m. | 4 |
| 11 a.m. | 4 |
| noon | 7 |
| 1 p.m. | 14 |
| 2 p.m. | 11 |
| 3 p.m. | 31 |
| 4 p.m. | 45 |
| 5 p.m. | 35 |
| 6 p.m. | 47 |
| 7 p.m. | 47 |
| 8 p.m. | 32 |
| 9 p.m. | 25 |
| 10 p.m. | 30 |
| 11 p.m. | 16 |
Tornado, severe thunderstorm and flash flood warnings for Rice County since 1986, by the hour each was issued, in Faribault's time; the two busiest hours darker.
Tracks within 20 miles since 1950, Storm Prediction Center